S&P 500 on the Verge of 6,000: What’s at Stake?

A lot has happened in the stock market since Liberation Day, keeping us on our toes. Volatility has declined significantly, stocks have bounced back from their April 7 low, and the economy has remained resilient. If you’re still feeling uncertain, though, you’re not alone. The stock market’s in a bit of a “wait and see”…

Why ADX Can Mislead You — And How to Avoid It

In this video, Joe walks through a comprehensive lesson on using the ADX (Average Directional Index) as part of a technical analysis strategy. Joe explains the key components of the ADX indicator, how to interpret DI+ and DI- lines, and how to identify strong or weak trends in the market. He also covers how to…

Three Charts Showing Proper Moving Average Alignment

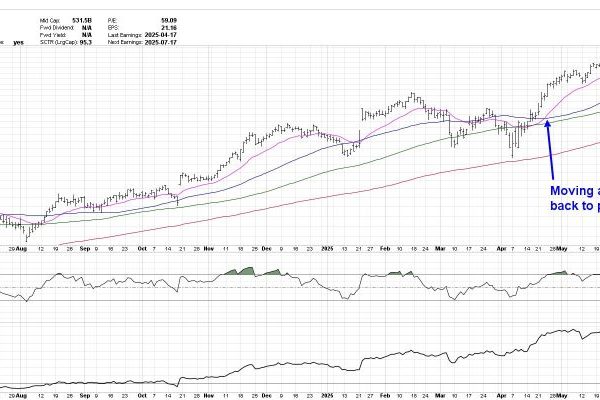
I’m a huge fan of using platforms like StockCharts to help make my investment process more efficient and more effective.  The StockCharts scan engine helps me identify stocks that are demonstrating constructive technical configuration based on the shape and relationship of multiple moving averages. Today I’ll share with you one of my favorite scans, called…

S&P 500 Bullish Patterns: Are Higher Highs Ahead?

In this market update, Frank breaks down recent developments across the S&P 500, crypto markets, commodities, and international ETFs. He analyzes bullish and bearish chart patterns, identifies key RSI signals, and demonstrates how “Go No Go Charts” can support your technical analysis. You’ll also hear updates on Ethereum, Bitcoin, the Spain ETF, silver miners, USO…

The Best Five Sectors, #21

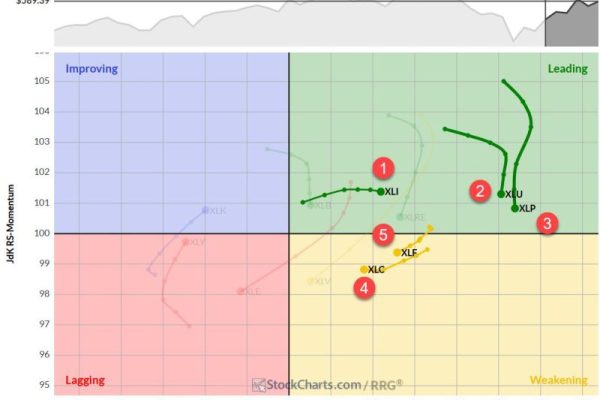
Staples and Tech Swap Positions Again The weekly sector rotation continues to paint a picture of a market in flux, with defensive sectors gaining ground while cyclicals take a step back. This week’s shifts underscore the ongoing volatility and lack of clear directional trade that’s been characteristic of recent market behavior. The sudden jump in…